 Online Store
The evolution of the United States’ external balance sheet in the last decade (wonky)
More on:
On Friday I tried to show why the US net international investment position deteriorated in 2008 – and also why it didn’t deteriorate in the previous years. Even after the market and currency gains of the past evaporated in 2008, the US net debt isn’t quite as big as an analyst who looked at the United States large cumulative current account deficit would expect. Some of the debt that the US thinks it sells to the rest of the world every year seems to disappear when the US goes out and tries to count the total amount owes the world – and how much equity in US companies have been sold to foreign investors.*
Yet even if the US data doesn’t show quite as much debt as it probably should, it still tells a lot going about what was on in the US – and the global – economy in the run up to the crisis.
It is consequently tempting to try to do a bit of forensic accounting to help understand how vulnerabilities built up. One thing quickly becomes clear. The US was piling up external debts in the run-up to the crisis even if the United States’ net international investment position wasn’t deteriorating.
The data in the NIIP can be disaggregated into debt and equity fairly easily. It is also fairly easy to separate out net official and net private claims. There isn’t a separate breakout for “official” investments in equities – as central bank and sovereign funds’ equity investments are aggregated together with their investments in US corporate bonds. But the US survey data indicates that official holds of equities were over three times official holdings of corporate bonds in the middle of 2008, so I don’t feel too bad considering "other official assets" a proxy for central bank and sovereign funds’ investment in US equities.
But don’t get bogged down in the details. There is no doubt that the US was clearly racking up debts to both official and private creditors in the run up to the crisis. Net US external debt (US borrowing from the world, net of US lending to the world) is now close to 40% of US GDP -- a fairly high level for a country with a modest export sector.
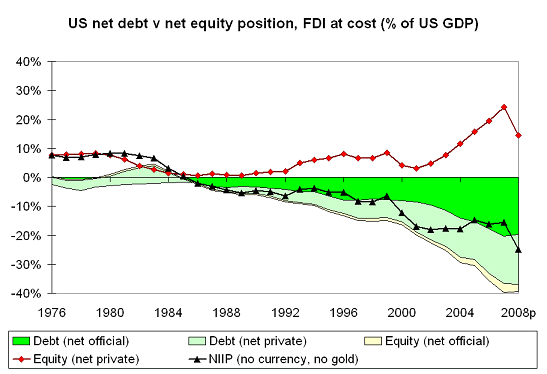
The steady buildup of US external debt though was long offset by the rise in the value of US equity investment abroad. In my calculations I valued FDI at cost; valuing it at its market value would have pushed net US equity holdings (US equity investment abroad – foreign equity investment in the US) up even faster and, of course, produced an even bigger fall in 2008.
Looking at the net data alone can be misleading. In some cases gross positions offset; it is useful to know if a stable net position reflects a symmetric rise in gross positions (or a symmetric fall).
Look at the data on "gross" official flows.
In 2008, for example, a rise in US “official” lending to the world – essentially the Fed’s swap lines – offset an ongoing rise in gross official claims on the US.
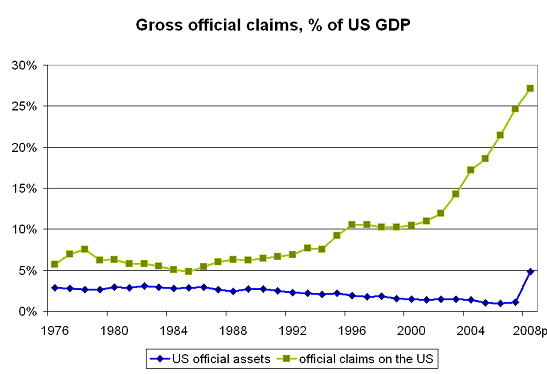
This data helps to clarify the debate on the dollar’s status as a global reserve currency – a debate that I often feel misses a key point. The dollar was a reserve currency in the 70s, 80s and 90s too. But total central bank claims on the US generally were under 10% of US GDP. They jumped a bit in the mid-1990s, when a surge in capital inflows to the emerging world allowed many countries to rebuild their reserves. They dipped a bit during the Asian crisis, as many countries few on their reserves to finance capital outflows. But they only started to soar in 2003, when the dollar started to depreciate against the euro and Japan and a host of emerging economies resisted pressure on their currencies to appreciate.
Somehow the usual debate on the dollar’s status as a global reserve currency suggests that little has changed over the past few years – the question is only whether countries will continue to want the dollar to be world’s leading reserve currency. But the debate over “market share” ignores the real issue: the size of the market. The dollar’s share of global reserves didn’t rise over the past several years. Rather countries holdings of reserves soared, and a constant (or even slightly falling) share and much larger stock produced a big rise in central bank holdings of US debt.
That shift mattered: It left many emerging economies with a lot of exposure to the dollar, and left the US exposed to the risk that key countries might lose their appetite to continue to hold dollars.
What of private debts? I plotted gross bank claims on the US against US bank claims on the world, and US holdings of debt securities against foreign holdings of US debt securities.
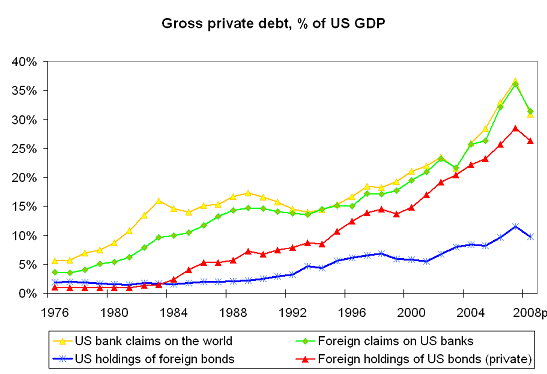
Gross banks soared in the late 1970s. Petrodollar recycling. It actually was more than just recycling though. US bank claims on the world increased faster than foreign bank claims on the US; in aggregate, US banks were using US deposits to provide financing to the rest of the world. That has changed.
Gross flows have generally trended up, but foreign claims on the US and US claims on the world rose together. The pace of increase though did pick up just prior to the crisis – probably because of the expansion of the shadow financial sector. But I am just guessing. Setting 2005 though, US banks weren’t a net source of financing to the rest of the world.
Foreign and US holdings of debt securities have both increased over time. Foreign holdings of US debt soared in the 1990s. That makes sense. A rising dollar made dollar-denominated US debt an attractive asset. And US firms were borrowing heavily to finance a lot of tech related investment; think of it as the US borrowing to build the information super highway (and no doubt to consume a bit too). The big rise in foreign holdings of US debt from 2002 on is a bit harder to understand. It obviously provided a lot of financing to the US household sector – as foreign demand shifted from “straight” corporate bonds to US asset-backed securities. But these inflows came in the face of a declining dollar. They presumably were done by investors with access to dollar financing – so the investors were taking the credit risk but not the currency risk. The US banking system though wasn’t in aggregate providing credit to the rest of the world, so it wasn’t in a position to finance these purchases. Someone else was supplying a lot of dollar financing in the world’s offshore financial centers (London especially). Figure out who, and I suspect that you have figured out a lot.
A disaggregated plot of the different components of the US net debt position shows that the deterioration in the last decade reflects a rise in (net) official claims on the US, and a rise in (net) private holdings of US debt securities.
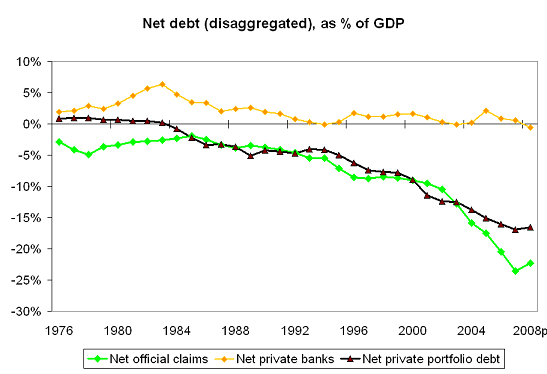
The mechanics of the rise in official holdings are well known (China, China, China and to a lesser degree Japan, Russia, Saudi Arabia and Brazil). The mechanics of the rise in net private holdings of dollar securities less so. Who wanted to take US dollar risk as well as US credit risk? And how was the dollar risk of say European banks buying US ABS shed?
A small point: some of the rise in private holdings may reflect disguised official flows, or at least official flows intermediated v private intermediaries. The US data shows that “official” investors had $3.5 trillion in “safe” US assets (I am setting aside official holdings of corporate equities, as those could be held largely by sovereign funds). Counting the PBOC’s other foreign assets and SAMA’s non-reserve foreign assets, the global pool of reserves was around $7.3 trillion at the end of 2008. If 60% of all reserves (a low end estimate) were in dollars, total central bank dollar holdings should be around $4.4 trillion; if 70% of all reserves (a high end estimate) are in dollars, the total rises to $5.1 trillion. That is a gap of between $900 billion and $1.6 trillion -- a sizeable sum. Net private holdings of US debt are around $2.4 trillion, though gross holdings are obviously much larger.
At least $300 billion of that is in offshore dollar deposits ($300 billion is the gap between the US data and the BIS data in table 5c), and quite possibly more. Some of the $350 billion in official holdings of “risk” assets shown in the US data is in central bank hands. But between $500b and $1000b is missing – perhaps because it is managed by private fund managers. Central banks handing dollars over to private managers thus could be one explanation for persistent private demand for dollar debt even as the dollar fell. But there are clearly others.
What of equities, and specifically portfolio equities?
The story here is simple. The value of US investment in foreign portfolio equities doubled, as a percent of US GDP, from 2003 to 2007.
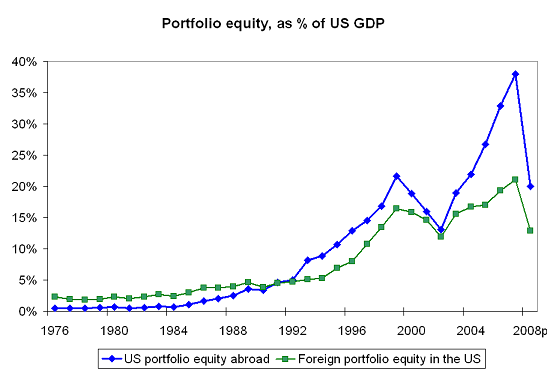
That isn’t primarily a reflection of large purchases of foreign equities by US residents. Cumulative purchases of foreign equities by US investors from the end of 2003 to the end of 2007 totaled $560 billion, implying valuation gains accounted for about $2.6 trillion of the $3.17 trillion total rise in US holdings of foreign equities. Rather it reflects the dollars’ depreciation, which pushed up the dollar value of US investments abroad – especially in Europe. And it reflects the fact that foreign stock markets dramatically outperformed the US stock market during this period.
Foreign investors bought nearly as many US equities as US investors bought foreign equities ($520b v $560b); the rapid rise in the value of US equity investment abroad relative to foreign investment in the US reflects the underperformance of US equity markets.
That in some sense is the great puzzle of the last six years. The US ran large deficits – and necessarily attracted large financial inflows – during a period when US markets consistently performed worse than foreign markets. Sure, that changed in the crisis. But the out-performance of the US then (US markets fell less than foreign markets) in the crisis hardly explains the persistence of inflows when returns on both safe and risky investments in the US lagged returns on comparable investments abroad. Foreign investors presumably weren’t buying US assets because they anticipated a US financial crisis.
The ability of the US to finance large deficits – and run up a large debt stock – during a period when returns on US investments lagged is the central puzzle of the global flow of funds. And it seems to me that one at least has to consider the possibility that the financing that supported these deficits weren’t entirely a “market” outcome.
* Some discrepancy between the stock and cumulative flows is to be expected -- especially as the stocks get bigger. Things like the repayment of principal on Agency MBS and asset-backed securities make proper calculation of the flow difficult. The presence of a gap in the data isn’t a surprise. The surprise is that the revisions consistency work in the United States favor.
More on: