Just How Unusual Has The Recent Spike in Soybean Exports Been?
More on:
In the spirit of bridging the urban/rural divide after a dramatic election, it somehow seems fitting to do a bit more soybean blogging.
The September trade data suggests that July’s dramatic spike in soybean exports in the seasonally adjusted data is probably petering out a bit. Real (e.g. adjusted for price) food and feed exports in September were around $12 billion; that is a couple of billion off the July-August highs of $13 billion. A “normal” level over the past few years would be around $9 billion per month.
For those who need a refresher, the true peak of U.S. soybeans exports usually comes in the fourth quarter, just after the harvest. They usually start to rise in September, with actual exports peaking in October and November. The volume of exports then fades in the first quarter. Relatively few U.S. soybeans are physically exported—in a typical year—in q2 and q3. In q2 and q3 global demand for soybeans is usually satisfied by production in the Southern Hemisphere.
This year, though, a bad harvest in Brazil meant that global demand in q3 was supplied out of U.S. inventories. Throw out-of-season exports into the model that adjusts from the strong seasonality, and, well, records are set.

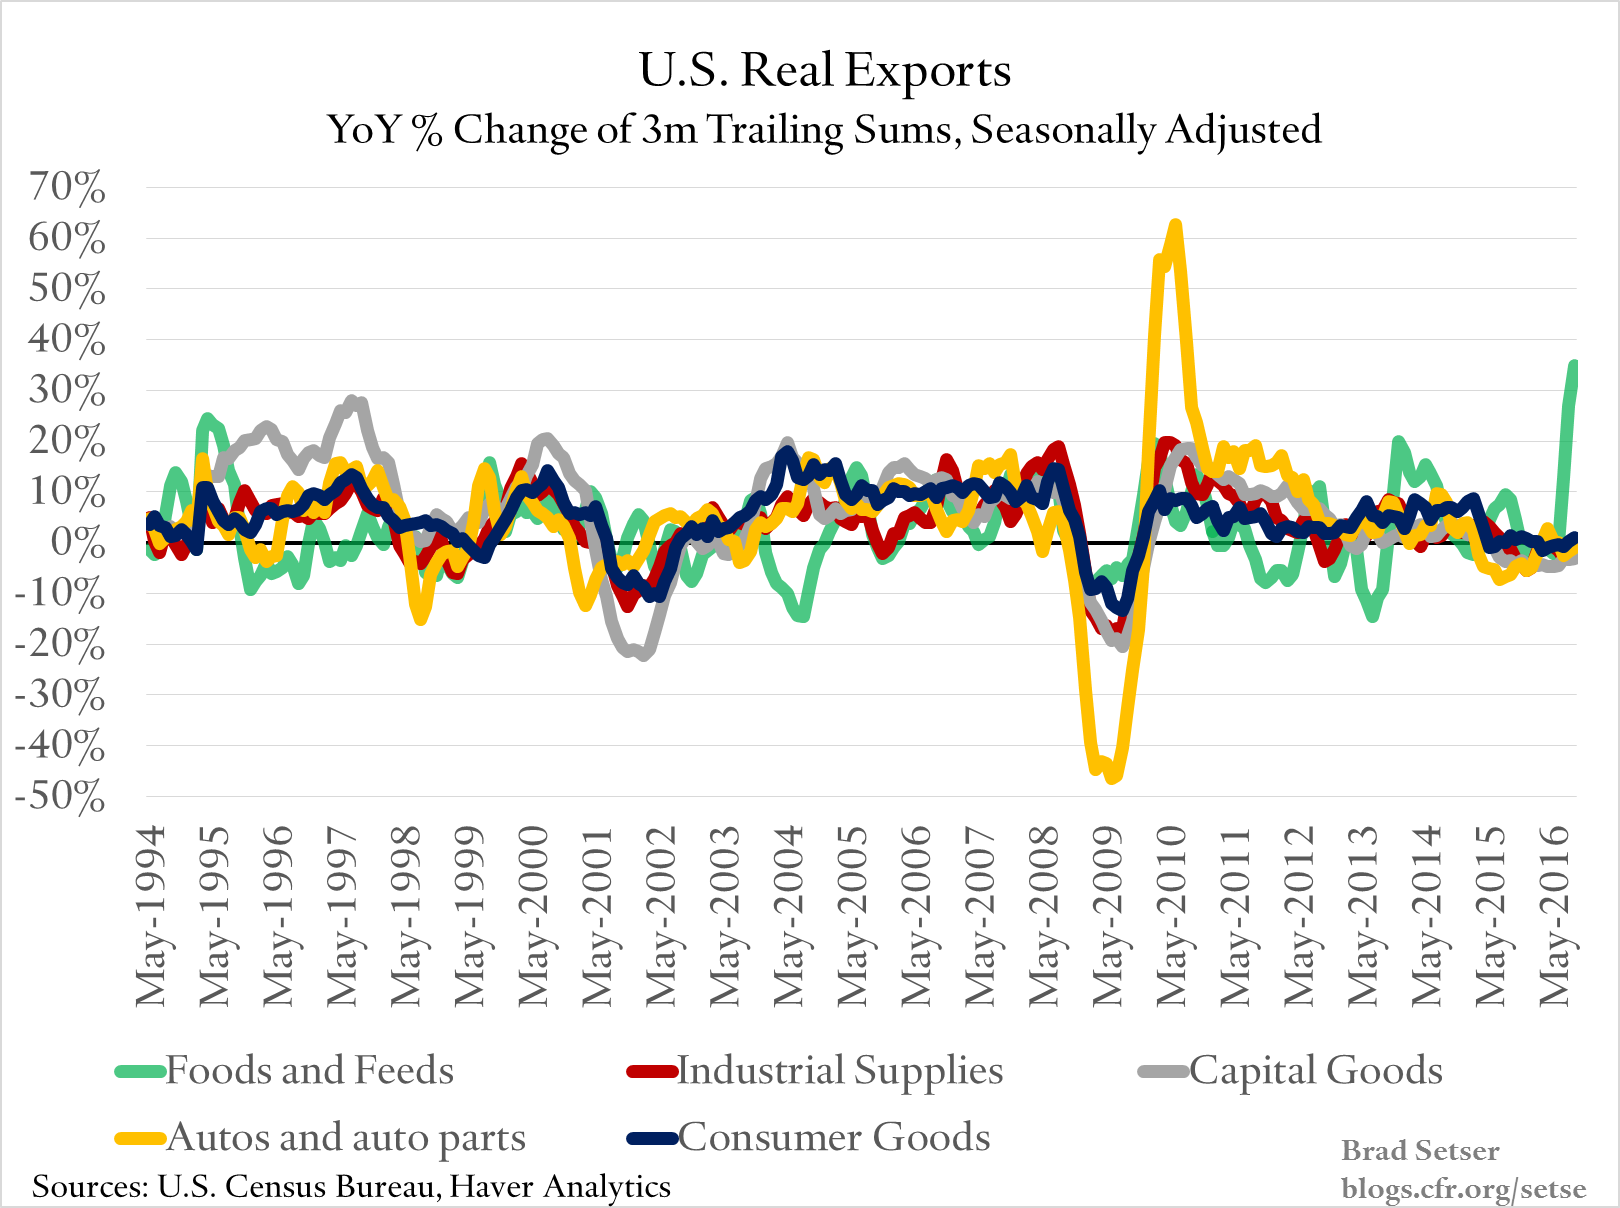
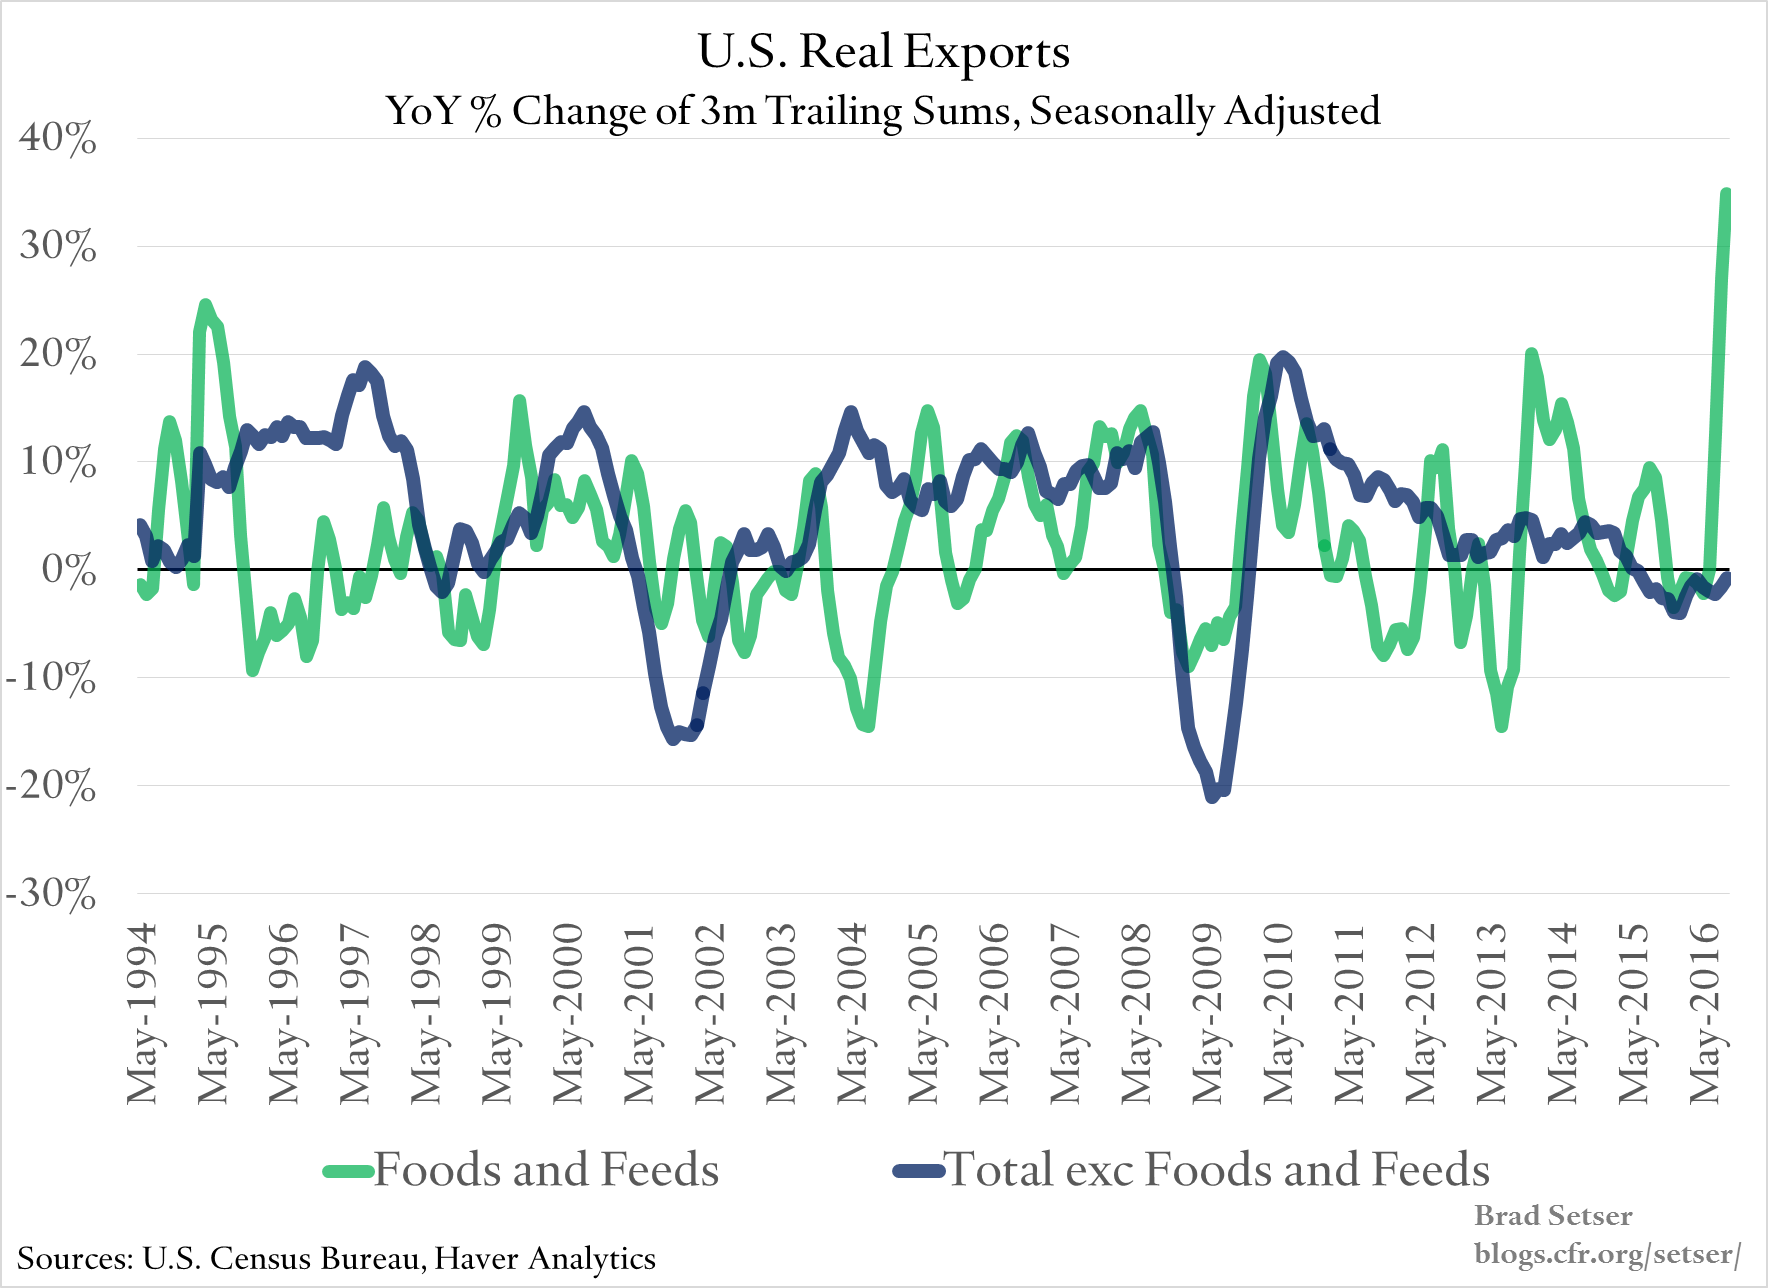
A 35 percent year-over-year (y/y) change in a trailing 3 month sum of one of the main categories of U.S. goods exports is just not something that you normally see. The swings in auto trade around the global crisis (remember, GM, and Chrysler were in a bit of trouble at the time too) were bigger, but not much else
The size of the q3 spike in agricultural exports was large enough that it basically throws off all y/y export comparisons (q/q will be worse). Excluding foods and feeds, y/y real goods exports are still down a bit (though the pace of the y/y fall now is a bit smaller than earlier in the year).

Food and feed exports have been around 0.75 percent of U.S. GDP recently (a bit more in 2014, a bit less in 2015—prices matter). 35 percent y/y growth would push that number up by 20-25 basis points in the annualized q3 numbers, when q3 is very roughly compared with q3 of the preceding year. Comparing q3-2016 versus q3-2015 though is a bit misleading in this case. Real agricultural exports were flat in q1 and q2—so on average for the full year exports are up a bit more than 10 percent. If real, seasonally adjusted agricultural exports average around $10 billion a month in q4, the year-over-year increase in exports would be around 10 basis points of GDP.
Basically, this is a classic case where a one-off event (out of season exports) paints a somewhat misleading trend in all annualized data. Annualized quarter-over-quarter numbers—like the estimated contribution from exports in the q3 GDP, which in effect annualizes the q3 versus q2 jump in real soybean exports—mislead even more than year over year comparisons. A roughly 20 basis point of GDP jump in a quarter annualized is a bit under a percentage point of GDP.
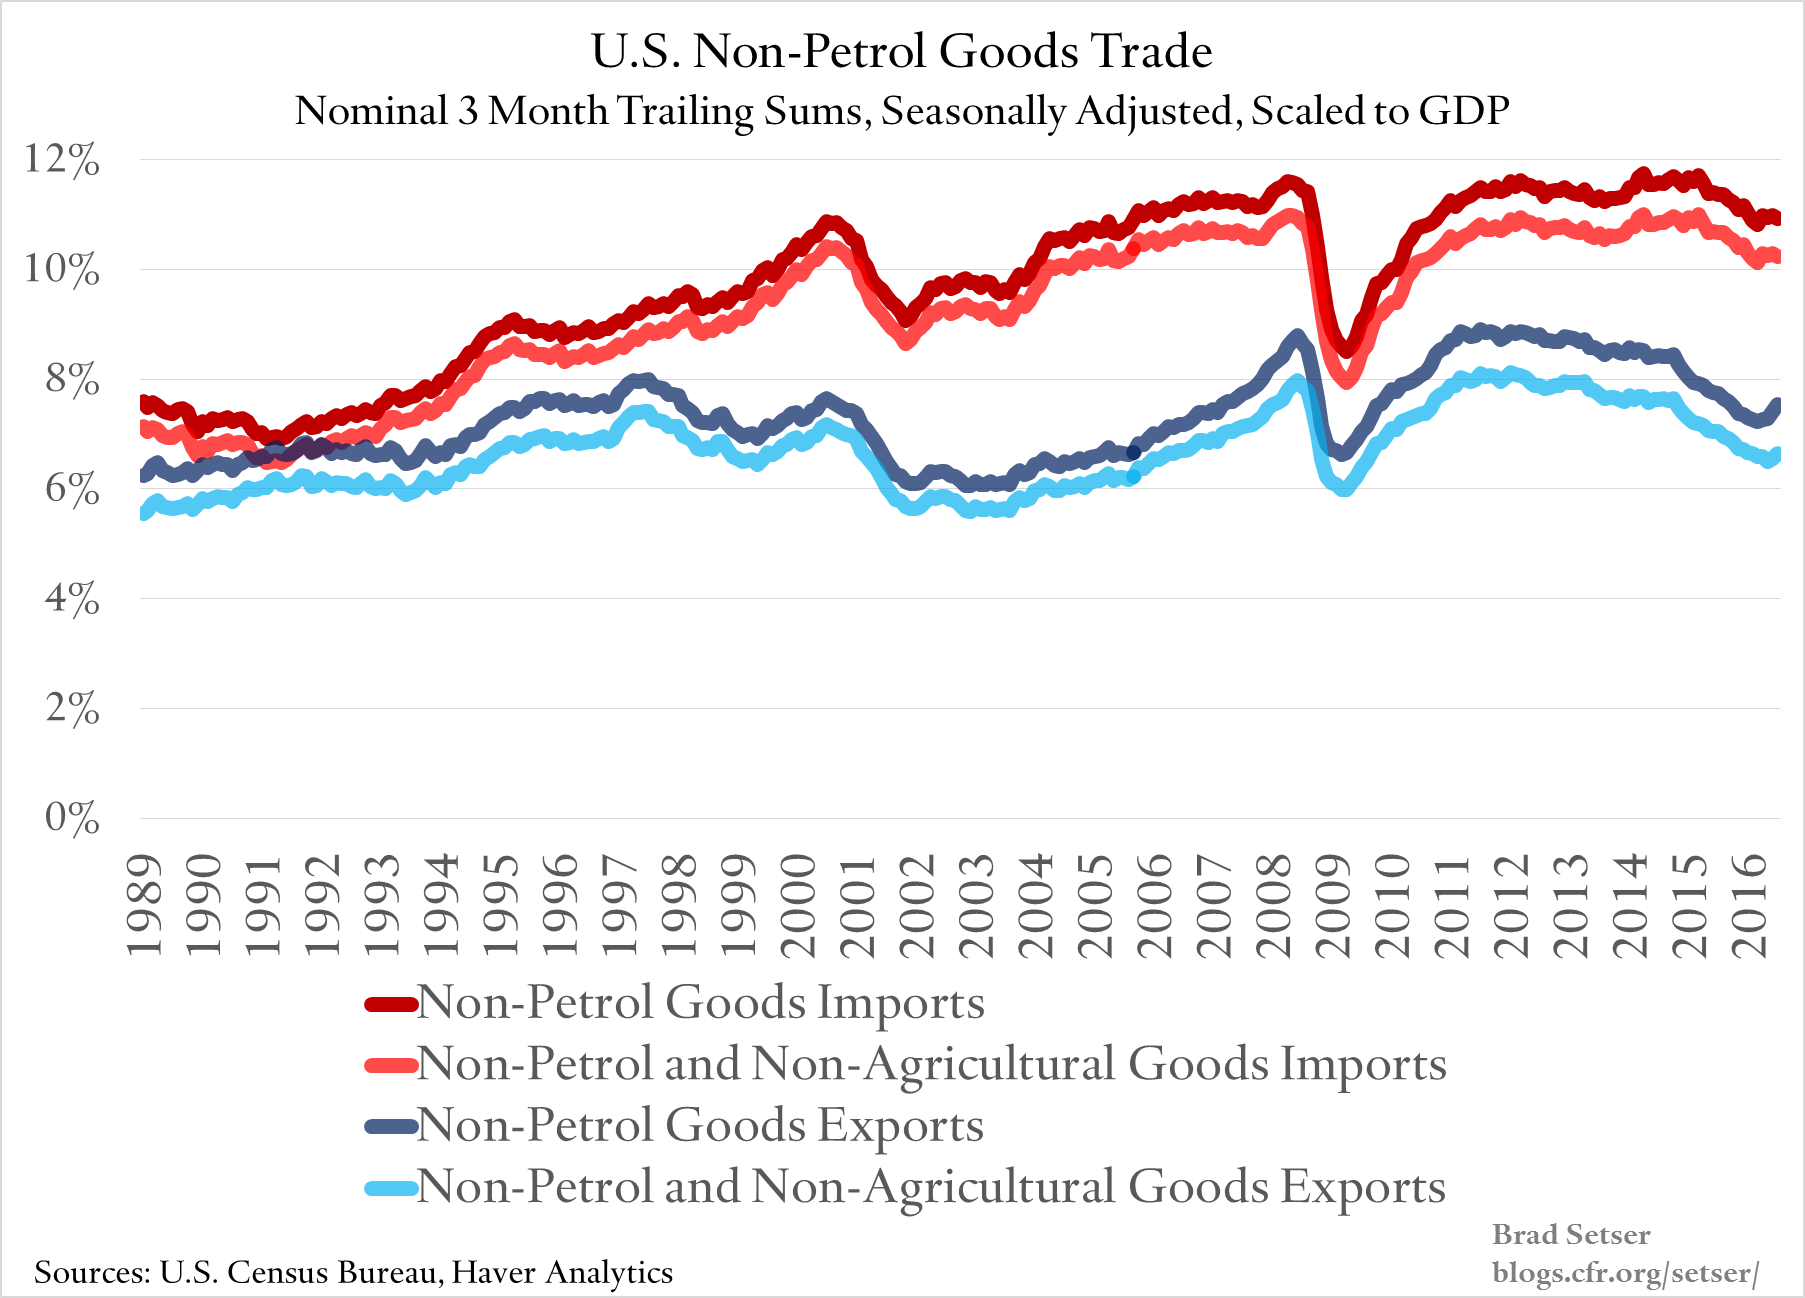
Excluding petroleum and agricultural goods, there isn’t a lot going on either on the import or export side right now. I plotted the nominal data as a share of GDP; but remember that a part of the recent slide is the fall in both export and import prices. Import and export prices, excluding foods and fuels, are both down 3-4 percent from their 2014 levels. The apparent stabilization in the recent data reflects a stabilization in prices, not big changes in volumes:

In broad terms, U.S. exports aren’t doing especially well, for fairly obvious reasons (the dollar’s strength, weak global demand). Excluding the commodity-driven export categories, real goods exports are down 2 to 3 percent year-over-year.
And U.S. import growth remains a bit on the weak side relative to the growth in U.S. domestic demand. Year to date (and in q3), real non-petrol goods imports are more or less flat (1.495 trillion 2009 chained dollars of real non-petrol goods exports so far this year, versus 1.499 trillion chained dollars in the first three quarters of last year; a 0.2 percent change, which is nothing…see Exhibit 11 of the latest Census/BEA trade release)
More on:
 Online Store