 Online Store
International efforts, such as the Paris Agreement, aim to reduce greenhouse gas emissions. But experts say countries aren’t doing enough to limit dangerous global warming.
The 2007 US trade data
More on:
The US December trade deficit was a bit smaller than expected -- thanks to a jump in exports (paced by a $1.35b increase in aircraft exports) and a big ($3.9b) fall in non-oil goods imports. The fall in non-petroleum imports offset a $1.45b rise in the bill for imported oil. The bounce in exports is obviously goods news; the fall in non-petroleum imports -- a fall that brought non-petroleum imports back to their end-December 2006 level -- is obviously bad news. It likely reflects a slowing economy, not a shift from imports to US products.
A graph of the y/y change in non-oil goods and services exports and imports shows that the improvement in the trade balance stems largely from the recent slide in the pace of import growth, not an acceleration in export growth.
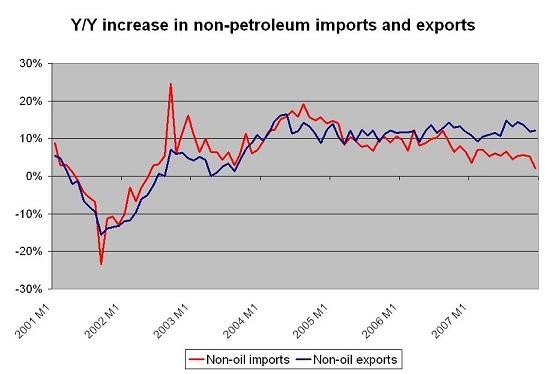
Indeed, abstracting from month to month volatility due to the timing of one-way delivery flights from Seattle area airports, export growth doesn’t look all that strong -- at least in real terms. Q4 real non-petroleum goods exports (exhibit 11) look to be roughly at the same level as in Q3. December strength made up for November weakness. Nominal growth is increasingly coming from higher export prices. Kansas is getting more on every bushel of wheat it sells to the world.
But rather than focus too much on the monthly data, I wanted to focus on the annual data. Both exports and imports trended up in 2007. And if you just look at the rolling 12m totals, it is hard to detect any change in export growth -- and even the dip in (non-oil) import growth takes a bit of work to see.
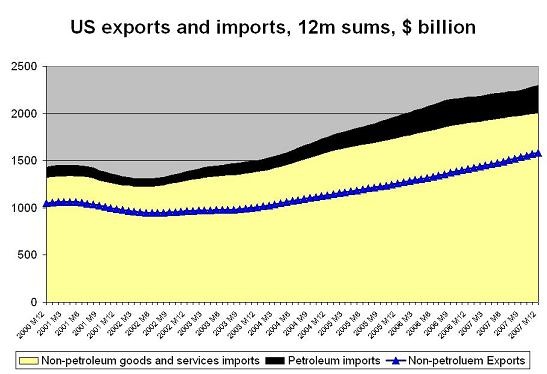
The key trends show up more readily in a graph of the actual deficit, broken into the petroleum and non-petroleum deficit.

Constant export growth and slowing non-oil import growth have brought done the non-oil deficit. But he improvement in the deficit seems to be slowing.
Look at the next graph -- which shows the (at the bottom) the y/y change in the deficit (comparing rolling 12m sums). The pace of improvement has indeed slowed.
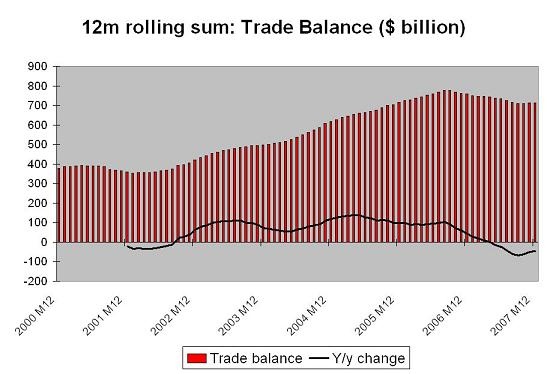
Blame the rise in the price of oil for absence of more improvement.
That is likely to be a big theme in 2008 as well. The average price of imported oil in December was $82.76 a barrel. The average for all of 2007 was only $64.27 a barrel. If the December price is sustained for the full year, the US imported petroleum bill would rise by almost $100b in 2008. That most likely would overwhelm the improvement in the non-oil trade balance.
The 2007 trade deficit (goods and services) came in at around $712b (5.15% of US GDP) -- down from $759b in 2006 despite an almost $30b increase in the United States oil import bill. The 2007 trade deficit is about the same size as the 2005 deficit in nominal terms, and thus certainly smaller in real terms.
If the income and transfers balance for q4 match their average for the first three quarters, the 2007 current account deficit should be around $760b, or 5.5% of US GDP. If the improvement in the income balance in the q3 data is sustained, the current account deficit might be in the $740-750b range.
If oil falls, the current account balance might improve more in nominal terms in 2008. If oil stays high though, I suspect the nominal deficit won’t improve by much -- even if a recession keeps non-oil import growth down. Right now, it looks like the 2008 US petroleum import bill will top $400b fairly easily.
I don’t want to dwell on the the bilateral deficits with different regions today.
Suffice to say that the bilateral balance with Latin America, India, Canada, Latin America and Asia-ex-China improved, while the bilateral balance with China, Mexico (oil) and OPEC all got worse. With imports from China growing faster than non-oil imports (11.7% v 4.6% for all of 2007 v all of 2006), I think there is growing evidence that China is taking market share away from countries that have allowed their currencies to appreciate by more than China has. But that is a topic for another day.
And in any case, right now, the rise in oil prices -- not the rise in imports from China -- is the dominant factor keeping the deficit up.
Finally, thanks to Arpana Pandey of the Council of Foreign Relations for helping to pull together the data in the graphs.
More on: