 Online Store
Introduction
Over the last several decades, governments have collectively pledged to slow global warming. But despite intensified diplomacy, the world is already facing the consequences of climate…

The Changing Shape of Unemployment
More on:
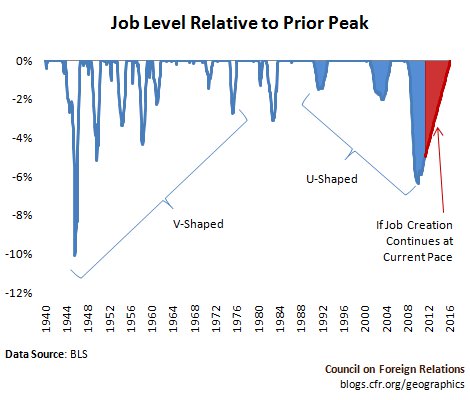
The shape of U.S. labor market declines and recoveries—as measured by the current level of employment relative to the prior peak—has changed dramatically over the past two decades. From the 1940s through the 1970s, they exhibited a V-shape of sharp declines and rapid recoveries, as seen in the chart above. By the 1990s they took on a U-shape, signifying longer, persistent unemployment. “During times like the 1950s and 1960s, a rising level of educational attainment kept up with this rising demand for skill,” MIT economist David Autor writes, “but since the late 1970s and early 1980s, the rise in U.S. education levels has not kept up with the rising demand for skilled workers.” The labor demand differential is particularly stark today: unemployment among the college-educated stands at 4.5%, compared with 14.7% for those without high school degrees. Unemployment compensation, the main tool in the U.S. arsenal to address joblessness, was created back in 1935 to buffer relatively short stints of unemployment, but the need today continuously to extend benefits is a sign that policy has got to address the skills mismatch far more effectively.
CGS Chart Book: Economic Recovery
CGS Chart Book: Economic Downturn
Working Paper: The Evolving Structure of the American Economy and the Employment Challenge
Spence and Hlatshwayo: Jobs and Structure in the Global Economy
More on: