Europe, engine of global demand growth …
More on:
If I had too pick two stylized facts about the global economy that I thought were under-appreciated, the first would be the enormous increase in emerging market reserves.
The IMF’s WEO data (remember, I like to start by looking at the IMF’s numbers, not its words) indicates that the emerging world added $1236 billion to their reserves. Throw in another $149b in official outflows (think sovereign wealth funds) for $1385b increase in the government assets of the emerging world. That total includes some valuation gains, but it excludes the increase in the government assets of the Asian NIEs (Hong Kong, Korea, Singapore, Taiwan), the increase in the foreign assets of China’s state banks and the increase in Japan’s reserves. Back in 2001 and 2002, the increase in the foreign assets of the emerging world was in the $125-200b range.
Emerging market governments now drive the global flow of funds – and allow the US to sustain a large deficit even as private demand for US assets (relative to US demand for foreign assets) has collapsed. But, as Steve Waldman has pointed out, this rise in official flows has been the core theme of this blog – so it shouldn’t be news.
The second fact is the extent to which Europe – yes, not-so-sclerotic Europe – has replaced the US as the engine of global demand growth.
By demand growth, I mean demand growth in excess of supply growth. That disqualifies China, as Chinese supply has grown faster than demand. Not so for Europe as a whole, or at least the countries that are part of the European Union (i.e. Norway is not counted). Between 2005 and 2007, the IMF estimates the United States balance of payments deficit shrank by $16b, while Europe’s expanded by $170b.
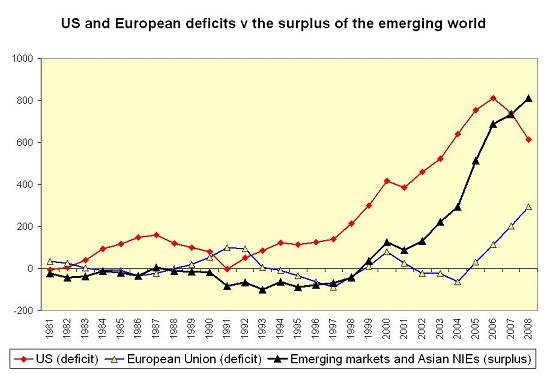
As a result, a rise in Europe’s deficit not a rise in the US deficit is offsetting the rise in the emerging world’s rising surplus.
Consider the following graph, which shows the US external deficit, the aggregate external deficit of the European Union and the aggregate surplus of the emerging world (plus the Asian NIEs). I have inverted the sign of the US and EU deficit – a bigger deficit is consequently a bigger positive number.

That is a change from the 2002-2005 period – when a $295b rise in the US deficit balanced most of the $382b rise in the emerging world’s surplus. It also implies that if the “rich advanced economies” are looked at as a whole, there has been less adjustment than might be expected. The overall deficit of Europe and the US continues to rise – which has allowed an ongoing rise in the overall surplus of the emerging world. In that sense, the world hasn’t adjusted.

The IMF forecasts the recent trend will continue in 2008 – with the US deficit falling by $124b (even with oil at $92b) and Europe’s deficit rising by $92b. Today’s trade data suggest that may be a tad optimistic. The nominal trade deficit for q1 could be larger than the nominal deficit in q4.
If the US oil import bill remains at its current level, the US petroleum deficit (imports net of exports) would deteriorate by about $110b. Consequently, the US non-oil deficit would need to fall by $235b or so to bring the US deficit down to the level the IMF forecast. That is possible – though only if non-oil imports don’t continue to jump up expectedly (as they did in February; non-oil goods imports were $140.8b – well above their levels last fall). The fall in US interest rates should help the US income balance, but bringing the overall deficit down as quickly as the IMF forecast requires a bigger change in the trade balance than has appeared in the data so far this year. (more follows)
One other small point about the trade data.
US exports to China so far this year are up 29.3%. US imports from China are up only 3.2%. The combination of RMB appreciation and the US slowdown has put a dent in the US deficit with China. Exchange rates do matter. China is – no surprise – increasingly relying on European demand to power its export machine.
But rates of change sometimes can be a bit deceptive. In dollar terms, US January and February exports to China are up $2.6b (over a year ago) while US imports are up $1.6b. 30% growth in exports and 3% growth in US imports – given the huge difference in the size of US exports and US imports – only translated into a $1 billion improvement in the January-February US trade deficit with China.
Every little bit though helps. At the least the US deficit with China is now falling.
More on:
 Online Store