 Online Store
International efforts, such as the Paris Agreement, aim to reduce greenhouse gas emissions. But experts say countries aren’t doing enough to limit dangerous global warming.
The problem with relying on the dollar to produce a real appreciation in China ...
More on:
Is now rather obvious. The dollar goes down as well as up.
Last fall, demand for dollars rose -- in part because Americans pulled funds out of the rest of the world faster than foreigners pulled funds out of the US. The dollar soared. As the crisis abated though, demand for US financial assets fell and Americans regained their appetite for the world’s financial assets. Not surprising, over the last few months, the dollar has depreciated.
And since -- at least for now -- China’s currency is tightly pegged to the dollar, the RMB also has depreciated. Fairly significantly.
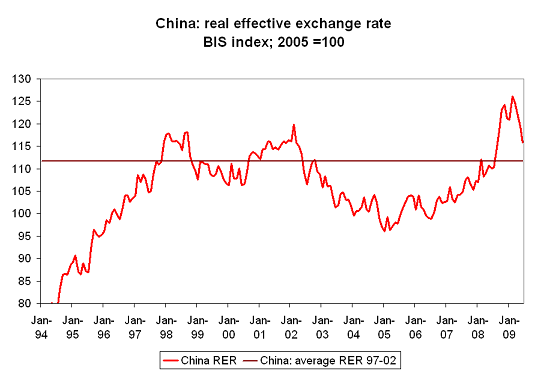
The real exchange rate index produced by the BIS suggests that, in real terms, the RMB is back where it was last June. That is when China more or less gave up on its policy of letting the RMB appreciate against the dollar and went back to something that looks like a simple dollar peg.
Does the RMB’s recent depreciation matter? I think so.
To start, China looks to be leading the world out of the current slump. That normally would result in an appreciating, not a depreciating, currency.
As importantly, there is now plenty of evidence that a weak RMB does have an impact on the pattern of global trade. A big impact.
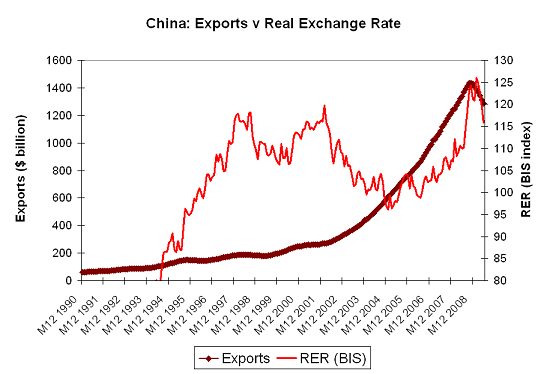
The boom in China’s exports that characterized this decade came after the dollar’s 2002-2004 depreciation produced a significant real depreciation of China’s RMB -- a depreciation that came just as a host of internal reforms pushed China’s own productivity up. The net result: a huge export boom.*
The average rate of growth in China’s exports in the years that followed the RMB’s depreciation was certainly far higher than the average rate of growth in the years when a a strong (and rising) dollar produced a strong (and rising) RMB.
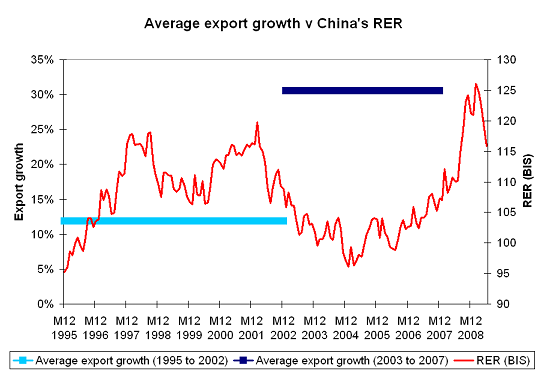
Yes, the 1997-2002 period includes a US recession and the 2003-2007 period doesn’t. But the recovery started in 2002, so looking at the 1997-02 period picks up a recovery as well as a recession. And the 2003-2007 period was also influenced by a US slowdown -- as for that matter is the 2003-2008** period. The US economy, remember, started to cool at the end of 2006. I don’t think that much stronger average US growth in 03-07 (or 03-08) relative to 97-02 is the best explanation for the difference in the average rate of growth in China’s exports over these two periods.
To be sure, the weak RMB isn’t the only driver of China’s export success. But the host of factors that make China an exporting powerhouse -- increasingly skilled labor, a growing network of firms that supply needed components, a lot of accumulated know-how in manufacturing, good infrastructure and the like -- normally would push the real exchange rate up. It took the combination of all these ingredients and the RMB’s real depreciation from 2002-2005 to generate the mother of all export booms.
And to me it is surprising that China’s real exchange rate at the end of June 2008 isn’t any higher than it was in late 2001 or early 2002. In every other respect China is a very different place. Lest we forget, in 2001 China’s exports only totaled $270 billion. That total was brought down by the US recession, but in 2002, China’s exports were still only $325 billion. By 2008 they had reached $1425 billion.
They are falling now, but it was still a phenomenal increase -- and one that in my view was the product, at least in part, of a slew of Chinese government policies, including the decision to intervene heavily to limit the RMB’s appreciation against the often depreciating dollar, that favored export growth over domestic demand growth. As Simon Johnson observes, China itself made the decision to accumulate a huge pile of dollar and euro reserves, reserves that now clearly far exceed what China needs to guarantee its own financial stability.
Remember, when exports were booming, China was running a tight fiscal policy and limiting domestic lending - -and thus restraining domestic demand growth. As the following graph -- from David Boucher of the University of Montreal -- shows, the loan to deposit ratio in China’s banks was generally falling during China’s export boom.
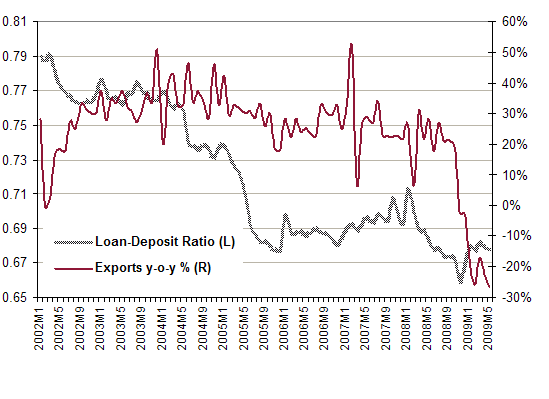
That was especially true from 2004 on, after Chinese policy makers opted to curb domestic inflation -- which picked up in 2003 -- by restraining lending rather than by letting the RMB appreciate.
China could have opted for a different macroeconomic policy mix back then -- one that might have limited the growth in China’s current account surplus. That in turn would have meant that China was less able to supply the US with financing, something that might have helped the US avoid a few of its own financial excesses.
UPDATE:
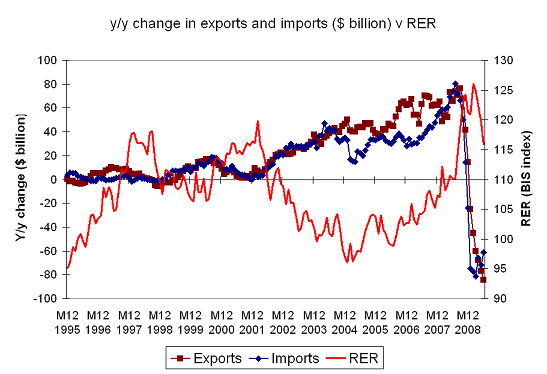
Don requested data on export and import growth. Here is the data, shown as a y/y change in billions of dollars in a 3m moving average of China’s exports and imports v the real exchange rate. Import growth failed to keep up with export from the end of 2003 to the end of 2007, something that I attribute to the combination of the depreciation in China’s RER from a level of 110 or above on the BIS index to a level consistently below 100 on the BIS index and China’s fateful decision to make a nominal renminbi depreciation consistent with low inflation by restraining lending growth and tightening fiscal policy. The moves in China’s imports since 2007 were strong influenced by gyrations in the price of oil, and then the global collapse of trade.
Not surprisingly, China’s trade surplus was rising during this period. The following charts shows the y/y change in China’s rolling 3m trade surplus, also in dollar billion.
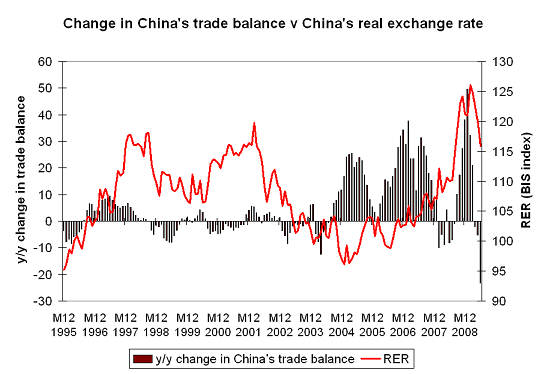
More recently, China’s surplus moved up (in q4 2008) and then fell (in q2 2009), which is presumably one reason why the IMF’s forecasts of China’s trade surplus -- as Menzie Chinn recently noted -- haven’t been all that stable.
* Exports are presented as a rolling 12m sum, in $ billion.
** Technically, I looked at the average y/y growth in a 3month moving average. Adding 2008 to the data doesn’t change much; average export growth from 2003 to 2008 was 28%. Adding 2009 in will bring the average down, but sorting out cause and effect is a bit hard, as the RMB appreciated as the global economy slowed. I would attribute most of the fall in China’s exports to the slowdown, but that no doubt will be debated.
More on: