 Online Store
International efforts, such as the Paris Agreement, aim to reduce greenhouse gas emissions. But experts say countries aren’t doing enough to limit dangerous global warming.
Real U.S. Gas Prices? Still Real Bad
More on:
Some readers of my post on Friday about record-high seasonal gasoline prices asked a good question: Were those data adjusted for inflation?
Answer: No, they weren’t. They were nominal prices. So what do the inflation-adjusted data show?
The bottom line: accounting for inflation doesn’t make the picture any prettier. In fact, it puts today’s seasonal U.S. gas prices in even starker terms historically (1979 anyone?).
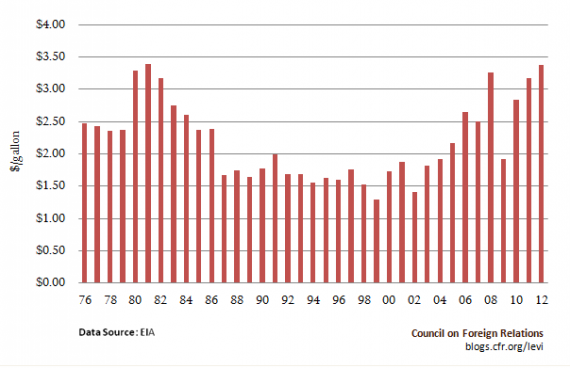
Figure 1 depicts U.S. retail average gasoline prices adjusted for inflation, during the month of January only, from 1976 through 2012. Last month’s $3.38 a gallon was essentially even with January 1981 ($3.39) as the highest January prices ever recorded by the U.S. Energy Information Administration (EIA). The next highest was January 1980 ($3.30), with 2008 and 2011 close behind.
Figure 1. U.S. Retail Price of Gasoline in January only between 1976 and 2012, Adjusted for Inflation (Monthly, EIA)
You can find the EIA’s official numbers here. Note that EIA data on retail gasoline prices only extend back to 1976 unless you’re talking annual figures, but those don’t tell us anything about seasonal variation during the year. Weekly data only go back to 1993.
Today’s gas prices are in rarified territory, even after adjusting for inflation.
More on: