 Online Store
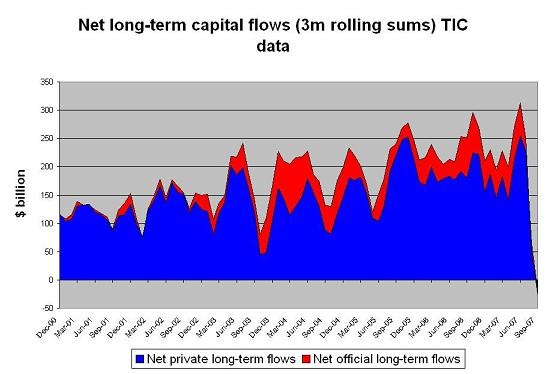
Scary graph
I didn’t use the term “sudden stop” in my post on the September TIC data release lightly. The attached graph -- which comes straight from the TIC data -- shows an extremely sharp fall in net purchases of US long-term financial assets over the last three months.
The data here only covers long-term flows – it doesn’t pick up very short-term flows. It also doesn’t pick up FDI flows. That said, neither short-term flows nor FDI inflows have been a big source of financing for the US deficit over the past few years. Most of the financing needed to sustain ongoing large external deficits has come from portfolio flows.
Three other caveats apply:
- The data here is a three month rolling sum. A 12m rolling sum would show a significant fall, but not quite as dramatic a fall as in the higher frequency data.
- The split between official and private flows in the TIC data is clearly off. Official flows make up a larger share of the total than the TIC data indicates. I state this with a high degree of confidence for two reasons; first, the revisions to the BoP data have consistently increased official flows once the survey data comes out; and two, the TIC data clearly isn’t picking up a lot of flows from the middle east, Russia and China and we know that they all have a ton of cash and that it is in official hands.
- The last data point comes from September. We are now in late November.
Nonetheless, a range of market indicators -- not the least the slide in the dollar v the euro since the end of September -- do not suggest a strong pick-up in private demand.
The counterpart to weak demand for US asset is record demand for European assets. The euro’s ongoing rally suggests that this hasn’t changed.
On the other hand, official demand likely has picked up – though it isn’t clear whether or not that will be reflected in the TIC data. A lot of Asian countries resumed adding to their reserves in October, and both China and the oil exporters – which have yet to report October data – almost certainly added large sums to their official assets.
The inflows earlier in the summer were quite strong – the $300b net inflow in the three months ending in June was more than the US needed to support its roughly $200b quarterly current account deficit. At the same time, it is hard to sustain a $200b current account deficit for long without any net long-term inflows …