 Online Store
International efforts, such as the Paris Agreement, aim to reduce greenhouse gas emissions. But experts say countries aren’t doing enough to limit dangerous global warming.
Six things to remember about the TIC data
More on:
I have boiled two years of experience with the (frustrating) TIC data into six easy lessons --and thrown in a chart showing the large gap between the official flows that showed up in the last survey and the official flows that showed up in the TIC data over the same time frame just to spice things up.
1/ Always look at the data on short-term flows. In February, the increase in short-term official holdings accounted for about $20b of the $33b in total recorded official inflows. Total flows were stronger than long-term flows.
2/ If the data on official holdings on Treasuries doesn’t make sense, look at the data from Norway for an explanation. The activities of Norway’s government pension fund appear in the “official data.” They seem to trade actively. In February, they sold $8.2b of long-term Treasuries and added $8.3b to their cash holdings. They also were big sellers of Treasuries in January ($11.7b). Sometimes this seems to reflect Norway’s willingness to sell options and the like to get a bit more yield. Sometimes it seems like the Norwegians are betting on the shape of the Treasury curve.
Right now, though, the Norway’s government fund is probably raising cash to buy more equities. By increasing their equity portfolio they are effectively diversifying away from the dollar. The US has a slightly lower share in their equity portfolio than their debt portfolio. Above all, though, raising the equity share increases Asia's weight in their portfolio (largely at expense of Europe). Selling high? Front-running the People's Investment Company?
3/ The TIC data usually provides very little useful information about what the other oil exporting economies are doing. The Asian oil exporters bought $1.2b of long-term debt and equity while reducing their short-term claims by $5.1b in February. Does that mean anything? Probably not. There hasn’t been a good correlation between the Gulf’s rising assets and the TIC inflows for a long-time. Russia increased its short-term holdings by $3.5b in February, after cutting its short-term holdings by $5.3b in January. That is probably just noise. We already know that Russia has diversified away from the dollar, and increasingly seems to be sifting from short-term to longer-term Agencies. But Russia’s purchases of longer-term Agencies don’t seem to consistently show up in the TIC long-term data (January is something of an exception). I think Russia buys in London rather than in New York.
4/ The TIC data systematically understates Chinese purchases. The last two surveys showed about $90b more in Chinese purchases than showed up in the TIC data. The most recent survey showed $193b of Chinese purchases of long-term debt between June 2005 and June 2006, v $105b in the TIC over the comparable period (the previous survey showed $165b in purchases, v $76b in the TIC). Recorded Chinese flows remained strong in February ($17.1 total inflows, $16.1b long-term debt, with $9.9b in long-term treasuries, $2.3b in long-term agencies and $3.9b of long-term corporate debt). However the TIC data almost certainly still understates actual Chinese purchases – Chinese reserve grew by almost $53b in February.
Some of that reserve growth likely came from shuffling pre-existing Chinese foreign assets between the state banks and the central bank. Stephen Green of Standard Chartered writes the "explosive increase [in Fx reserves] is likely explained by funds that has already entered China moving around, rather than new hot money inflows." Basically, some of China's hidden reserves stopped hiding (see Richard McGregor of the FT for more). But I would still guess China bought more than $17b.
5/ Sometimes the TIC data really does tell you something. Brazil increased its dollar holdings by $9.1b in February (mostly long-term Treasuries). Its reserves went up nearly as much. India’s reserves also increased by about $10b in February, but its recorded US holdings only increased by around $4b (mostly short-term stuff). Brazil has a large share of its reserves in dollars; India doesn’t. For the little it is worth, Korea has been significant net seller of US assets in both January and February – its $3.9 in Treasury sales in February were not offset by its $0.6b in corporate bond purchases, and its short-term holdings actually went down. The Bank of Korea (BoK) is now on my “diversification” watch.
6/ Don’t trust the TIC’s breakdown between private and official inflows.
(Chart follows)
Because of China – and to a lesser extent the oil exporters – there is now a large gap between the official inflows implied by the survey and the official inflows recorded in the TIC data. The gap in the latest survey was around $120b over the course of a year, or $10b a month. Stronger reserve growth suggests that the size of the gap has, if anything, increased. Look at the following chart.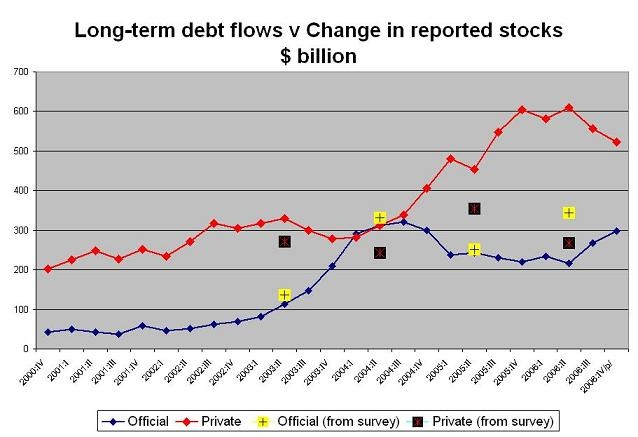
Judging from the most recent surveyt, the TIC data massively under-counted official purchases between end-June 2005 and end-June 2006 – and even more massively over-counted private purchases.
The fact that the historical data on official purchases matches up pretty well until mid 2004 likely reflects revisions to the data – the BEA (I think) adjusts the flow data to reflect the stock data over time. The US TIC data does a far better job counting official Japanese purchases than Chinese or oil purchases. Japan doesn’t make as much use of Hong Kong, or London …
But I don’t quite understand the enormous gap between the recorded private inflows and the change in private holdings reported in the survey. The fall in implied private purchases was much larger than the rise in official purchases. Talk about a black hole!
There is another indication that the TIC data -- especially the recent TIC data -- understates official flows. The recent TIC data hasn't matched up well with the increase in the Fed’s custodial holdings. The TIC data shows a $13.1b increase in official holdings of long and short-term securities in January and a $14.5b increase in February (this is the sum of lines 9, 25 and 28 on the TIC release; this total is smaller than line 32 because doesn’t include central bank deposits in the US banking system). The custodial data shows an increase of $38.1b in January and $43.2b in February.
Many analysts have noted that Agency purchases fell off in February -- at least judging from the TIC data. The custodial data tells a somewhat different story though. Central banks' custodial holdings of agencies increased by $16b.
The TIC data theoretically includes things like foreign official purchase of corporate debt while the custodial data just shows holdings of Treasuries and Agencies, so the TIC data might be expected to show more flows than the custodial data. Dream on ...
The Federal Reserve has prepared a nice overview of the TIC and survey data that explains how the increase in custodial holdings can exceed the official inflows reported in the TIC data: a foreign central bank can buy a US treasury (or agency) in London, and then ship the security over to the New York Fed for safekeeping. The purchase – in London – would never register in the TIC data.
Incidentally, the Federal Reserve’s guide to the data suggests that actual official holdings are likely larger than reported in the survey – which is, at the end of the day, a survey of the foreign holdings of US custodians. Lots of foreign custodians end up assigning US securities bought for their clients in say London to a US custodian, so the survey picks up some things the TIC data doesn’t pick up. But it doesn’t pick up everything. I suspect that this is particularly true for the Middle East.
And after reading the Fed’s description, I am fairly confident that official funds farmed out to private managers would be recorded as “private” in the survey data.
All this said, from the US point of view, there was a bit of good news in February TIC data: US investors – who had been big buyers of foreign bonds in the fourth quarter – lost a bit of interest in foreign bonds in February. The fall-off in US purchases of foreign bonds helped push net inflows above the US current account deficit. Net inflows came in at $95b, more than the US needs to cover the roughly $70b February current account deficit (the current account deficit is about $10b a month larger than the trade deficit).
More on: