 Online Store
Solar Power’s Paradoxical 2015 in Three Charts

More on:
This post is co-written with Sagatom Saha, research associate for energy and foreign policy at the Council on Foreign Relations.
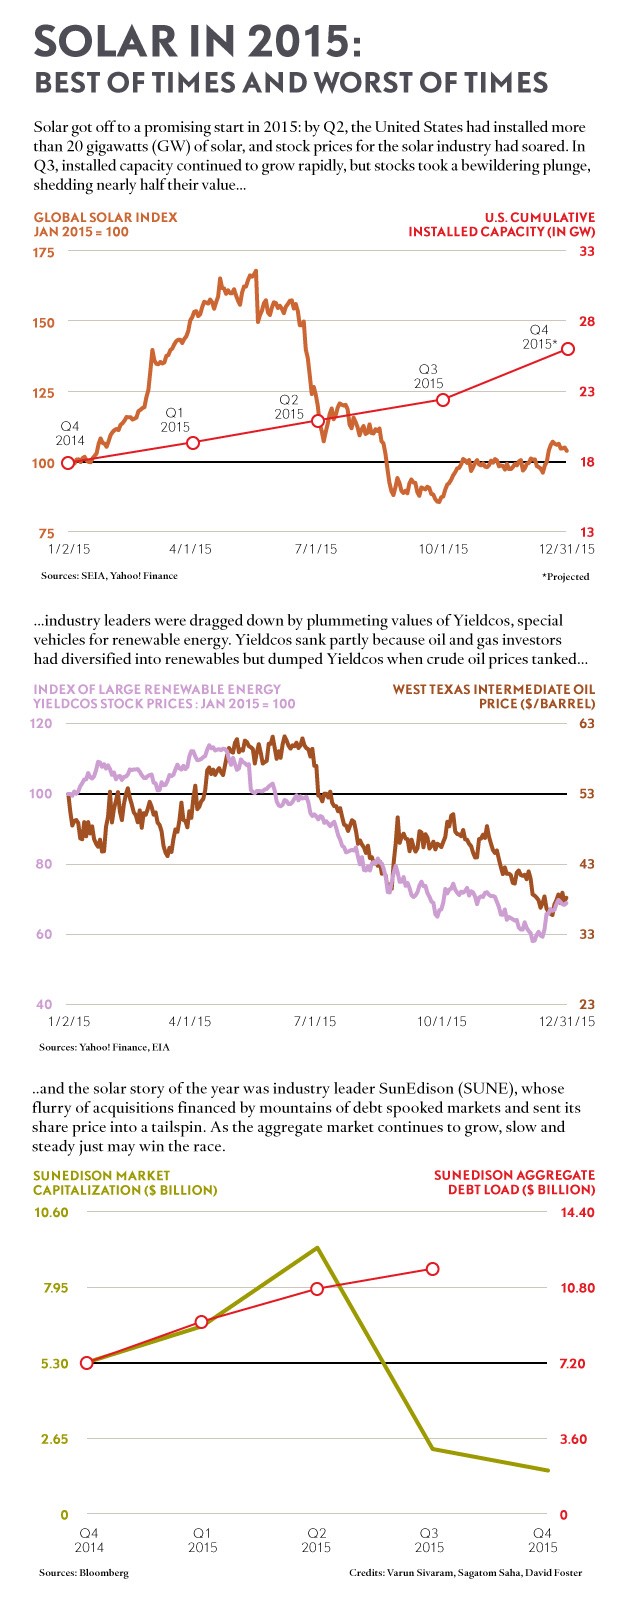
In his final State of the Union address, President Obama celebrated the remarkable growth of clean energy, particularly solar power, which in 2015 added 7.4 GW of capacity in the United States and 55 GW globally. However, he also omitted an equally remarkable trend: over the same year, the Global Solar Index, which tracks the overall industry, collapsed, losing nearly half its value from a mid-year high.
The divergence between solar market growth and solar industry market value began in July, perplexing analysts and investors. By December, company stocks may have finally bottomed out after news broke that Congress had extended generous U.S. solar tax credits for five years. Despite record global installed capacity and falling costs, solar companies either stagnated or fell in value in 2015 depending on the measuring stick applied.
What explains solar’s paradoxical year? The three charts below demonstrate how falling crude oil prices and overzealous expansion combined to undermine solar companies. For an in-depth look at other factors—like the glut of public stock offerings and fears about interest rates—that affected renewable energy Yieldcos in particular, see my piece in Fortune.
Since the end of 2015, SunEdison’s stock has fallen even further, losing approximately half of its market capitalization as of mid-January 2016.
More on: