Why no dollar crisis? The needed flows don’t show up in the TIC data ...
More on:
Ken Rogoff notes that at least one thing hasn’t gone wrong during the United States current financial crisis: the dollar hasn’t crashed.
One of the most extraordinary features of the past month is the extent to which the dollar has remained immune to a once-in-a-lifetime financial crisis. If the US were an emerging market country, its exchange rate would be plummeting and interest rates on government debt would be soaring. Instead, the dollar has actually strengthened modestly, while interest rates on three- month US Treasury Bills have now reached 54-year lows. It is almost as if the more the US messes up, the more the world loves it.
He is right. There isn’t any data for the last month -- but I suspect the dollar ’s resilience is due both to a sense that the rest of the world is slowing far more than the already sluggish US and to of a general flight from risk, including emerging market risk. Americans seem to have started to bring some of the funds they invested abroad back home, supporting the dollar. I also suspect I know why the dollar didn’t fall by more after last August’s subprime crisis: the quiet bailout. The worst the dollar does, the more central banks tend to buy. That allowed the US to sustain large deficits over the past year.
The TIC data – especially after 2004 – has consistently understated official inflows. I won’t bore you with the details. Just trust me, it is true. Different data sources tell different stories – and they all tell us that the monthly TIC data understates official flows in general and flows from China and the Gulf in particular. We know, for example, that total official purchases of Treasuries between the end of 2000 and mid-2007 (the last survey data point) are roughly twice as large as implied by the TIC data.
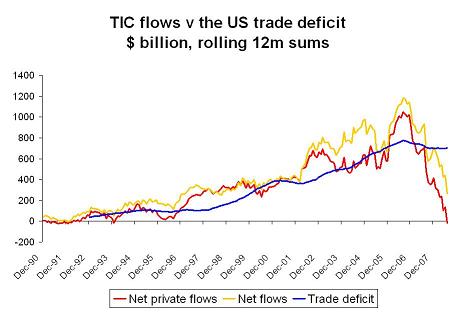
Even so, total TIC flows provide some indication of total foreign demand for US assets, and total TIC official flows provide a rough guide to total official purchases. And, well, total TIC flows – counting short-term flows as well as long-term flows – are well below those needed to cover the US trade deficit. Indeed, total private flows, counting short-term flows, recently dropped to zero.
The TIC data isn’t a perfect reflection of all the line items in the balance of payments. Most notably, it doesn’t include FDI flows. But a host of data suggests that FDI inflows and outflows roughly offset. I don’t think big net FDI inflows explain why the US deficit hasn’t fall along with total net foreign inflows. There is something more going on. I just need to figure out what it is.
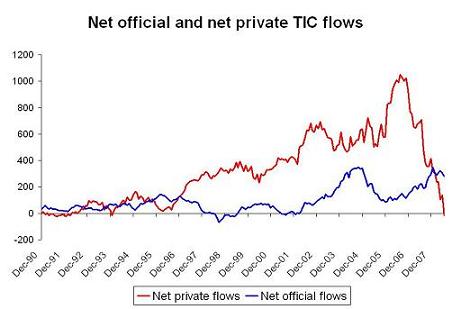
There is one part of the data that I do think I understand: official inflows. A graph plotting official flows v private flows shows that the composition of net flows to the US has shifted significantly over the past two years.
The kicker? I strongly suspect that the TIC data understates official purchases -- relative to the survey -- by a a something like $300-350b over the last 12ms (this is a testable prediction we will see when the next survey comes out). That implies that official inflows are really more like $550-600b, and private inflows are deeply negative – not zero. And the survey also misses some official flows, notably from the Gulf.
Negative private inflows is another name for private outflows. For emerging economies, those outflows are called capital flight.
One caution: the data only runs through July. There is plenty of evidence that suggests that private funds that had been invested in the emerging world came home over the past three months. That was true in July. I would bet it is true in August and September too.
Selling off your existing assets is one way to fund a deficit.
And one small technical point: the flow of funds data puts total official holdings of Agencies at $1.1 trillion at the end of q2. That is a bit higher than the FRBNY data and significantly above the total implied by adding up known official agency purchases since last June’s survey. It also strikes me as close to right – as the flow of funds seems to be using the FRBNY data to derive its estimate rather than the TIC flow data and in this case the FRBNY data is better.
More on:
 Online Store

