 Online Store
International efforts, such as the Paris Agreement, aim to reduce greenhouse gas emissions. But experts say countries aren’t doing enough to limit dangerous global warming.
Be careful — real export growth looks to have slowed
More on:
Unless your family is in the wheat or beans business (wheat and soybeans exports have more than doubled when q1 08 is compared to q1 07; total food and feed exports are up 50% y/y), there actually wasn’t a lot to like in this month’s trade release.
Yes, the headline deficit fell relative to February, but February looks to have been a blip. The rolling 3m deficit has been stable at around $59.5b since December. And much of the fall in the deficit came from a big fall in the volume of imported petroleum. Petrol imports (in volume terms) were running ahead of last year’s pace in January and February. March brought the year to date total down below last year’s total, as the volume of imported crude was about 15% lower than the volume of imported crude last March. The fall in volume was large enough to offset a rise in price. The price of imported crude jumped from $84.76 to $89.85, but the seasonally adjusted US petrol import bill still fell by $2.2b, from $37.4b to $35.2b.
The real problem though was on the export side. Export growth looks to be slowing. The headline nominal growth numbers look good. Y/y non-petrol goods exports are up by a healthy 14.8% -- far more than the 3.3% growth in nominal non-petroleum imports. But if the rise in agricultural exports and exports of industrial supplies (petrol, chemicals, metals) is stripped out, export growth was only up 5.2% 8.8% in nominal terms (oops; my bad).
Slower growth among those exports whose price hasn’t obviously increased is a warning sign.
A plot of real goods exports and imports shows a small monthly fall in exports in March.*
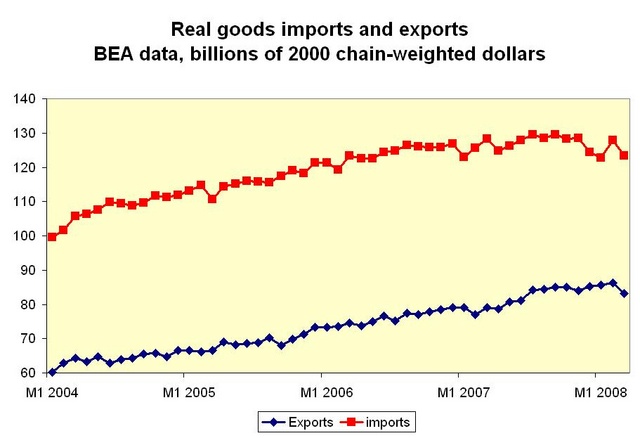
The data bounces around a lot, but it certainly seems that the pace of growth in real US goods exports is slowing. March real goods exports fell back below their level last June (see Exhibit 10). The usually reliable FT missed this part of the story, opting to highlight ongoing growth in nominal exports ("second-highest monthly" total in history despite the down tick from February) rather than the not-so-strong real growth.
Dollar depreciation helps, but a slowing world economy hurts. Countries that are spending more on oil may have a bit less to spend on other goods. Plus, in some sectors the US may be hitting capacity constraints. Boeing is a case in point: it needs to get its 787 assembly line sorted out …
The improvement in the nominal trade balance – plotted on a rolling 12m basis* – also has stalled.
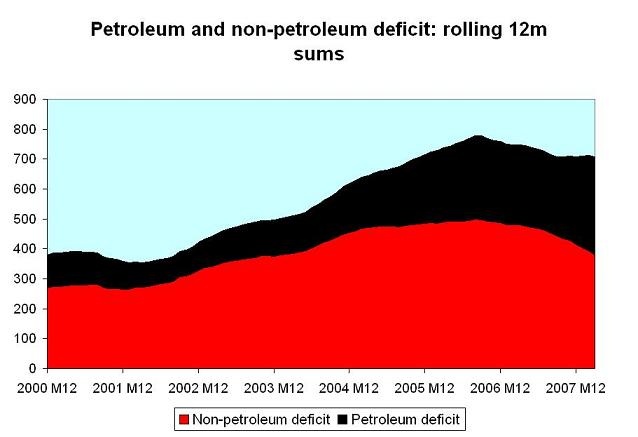
It isn’t hard to see why: oil
And there is more bad news in the pipeline. Project out $89 a barrel oil for the remainder of the year and the oil balance deteriorates by over $100 billion in 2008. Project out $110 a barrel oil and the oil balance deteriorates by over $200 billion in 2008. The average price of imported oil in q1 of 07 was only $52 a barrel; the average price for all of 2007 was only $64.27 a barrel. That calculation, by the way, assumes that the volume of petrol the US imports continues to fall slowly.
One other point:
The improvement in the US trade balance with China (the deficit was $2.2 billion smaller in q1 2008 than in q1 2007) comes far more from the fact that US imports from China have essentially stopped growing (up $1.3b) than from a rise in exports (up $3.5b). Nominal imports from China in q1 were up only 1.8%; and nominal imports from Asia were up only 1.6%. Imports from Asia actually are growing at a slower nominal clip than imports from Canada or Europe. I am not sure if that reflects “J-curve effects” (flat volumes and rising prices lead to higher nominal imports are an exchange rate move) or petroleum and gas imports. The US obviously imports energy from Canada, and I think it also now imports some refined gasoline from Europe. Energy experts please correct me if I am wrong!
*Thanks to Arpana Pandey of the CFR for help with the graphs
UPDATE: There is nothing like a bit of attention from the big blogs to inspire a bit of additional work. Y/y real goods exports are up 9.5% -- while y/y real goods imports (non-petrol) are down 0.8%. And the y/y growth in real goods exports is fairly broad-based. Ag export volumes are up 13.4% and real exports of industrial supplies are up 13.1%, but volumes for everything else are up 8.2% as well. The trouble is with the quarterly pattern of growth, which suggests some deceleration in export growth.
q1 08 real goods exports are 0.8% higher than q4 07 real goods exports (an annualized growth rate of 3.3%) and q4 07 real goods exporters were 0.6% higher than q3 real goods exports. the q3 over q2 growth rate -- 5.6% -- and the q2 over q1 growth rate -- 2.1% -- were much higher. Basically the strong y/y growth reflects strong growth in the middle of 07 rather than strong ongoing export growth.
Non-petrol real goods imports were down 1.9% in q1 08 (v q4 07) -- which can be compared to a 1.7% quarterly fall in q4 07, 2.3% quarterly rise in q3 and 5% quarterly rise in q2.
Finally, i should note that I initially miscalculated y/y nominal growth in non-ag, non-industrial supply exports. The right y/y growth rate is 8.8%, not 5.2%. My apologies.
More on: