 Online Store
International efforts, such as the Paris Agreement, aim to reduce greenhouse gas emissions. But experts say countries aren’t doing enough to limit dangerous global warming.
The December TIC data lifts the curtain that has hidden how the US has financed its deficit
More on:
There has been no shortage of bad news coming out of the US today -
-- A fall in consumer confidence;
-- Flat manufacturing;
-- A fall in the Empire state index;
-- A UBS report predicting big additional losses in the banks
A not-particularly-good TIC data release hardly even registered. But make no mistake - December capital inflows into the US were on the weak side. Net flows were only $60b, a bit under what the US needs to cover its current account deficit. Net long-term flows were only $45b.
The TIC data (found here) though did at least make one thing clear - in December, there really can be no argument about who financed the US deficit.
Central banks and sovereign funds supplied the US with $52.1b of financing, $35.8b in long-term financing and $16.3b in short-term financing.
Private investors supplied $8.4b (net).
And we already know central banks and sovereign funds supplied the US with even more financing in January than in December.
Talk about a reverse bailout. Emerging market central banks have been far more generous to the US - and emerging market sovereign funds far more generous to US banks, investing without seemingly doing much due diligence - than the US, the G-7 and the IMF were to the emerging world in the 1990s.
(Details follow)
As I constantly note, the pattern of past data revisions suggests that the TIC tends to understate official inflows and overstate private inflows. The June 2006 survey led to very large upward revisions in official holdings and official purchases.
However, in December, there wasn’t much demand for "safe" assets coming from the UK. That tends to be the main source of undercounting (apart from the difficulties capturing SWF equity investment managed by private fund managers), so undercounting of official purchases may be less of an issue in December than in other months.
But for q4 as a whole, I would bet that a reasonable chunk of the $162.3b in private inflows (v $138.7b of official inflows) is actually "hidden" official inflows. The nearly $60b in "private" Treasury purchases and the $20b in private Agency purchases in q4 look a bit suspicious to me - though it is possible I am underestimating the demand from European banks (and various offshore vehicles set up in London) for safe, liquid US assets.
No matter.
In q4 there also was an interesting shift in the composition of official demand though. $12.5 of the $15b in total (recorded) official purchases of equities over the course of calendar 2007 came in December. Both Singapore ($4.7b) and the Gulf ($7.1b) were big buyers of equities. Merrill/ Temasek and Citi/ ADIA? I didn’t see overt evidence of Morgan Stanley/ CIC.
The $15b in total recorded official purchases of US equities no doubt understates the "real" total. But total official demand for equities still is small relative to official demand for long-term bonds ($172b in 2007, another understated total), or for that matter, the increase in central banks short-term holdings ($110b, counting short-term Treasury and Agency securities as well as bonds).
If all central bank reserve growth is channeled toward sovereign wealth funds and they start buying equities on a big scale, it will be a huge shift.
For the year, central banks bought way more long-term Agencies ($120b) than corporate bonds ($51b) or Treasuries ($3b) - though I would caution that these totals are understated. Remember, central banks (counting all of SAMA’s foreign assets) added at least $1200b to their reserves. Way more central bank and sovereign fund money than the roughly $300b now "visible" in the official US data made its way to the US.
In q4 official demand for corporate bonds was comparable to official demand for Agency bonds were around $20b. That is stabilizing. Official demand made up for a lack of private demand. But before we give the world’s central banks too much credit, it is worth noting that they added $69b to their short-term holdings. That is not stabilizing. There is no shortage of private demand for "cash’ and its close equivalents right now.
Who were the big buyers in December -
First China, which added $25.2b to its portfolio ($7.9b short-term, $6.9b Treasuries, $2.6b Agencies, $7.7b of Corporate bonds and only $0.7b of equities). Hong Kong chipped in another $9.3b, including $4.7b of equities - which may reflect indirect Chinese demand.
A formerly Communist country - Russia - chipped in another $12.4b, mostly ($9.5b) short-term Agencies. Russia’s willingness to use of its control over energy supplies as a political lever has made it among the countries whose outward investment has raised the most fears, but - being a cynical type - I also wonder if the absence of any real fee income from its very conservative external portfolio has left it without as many vocal defenders as some other countries.
The Gulf added $5.4b - with falling Treasury and Agency holdings offsetting a big equity investment.
The Brazil only added $1.2b, with a fall in its short-term holdings offsetting big increases in its long-term Treasury holdings.
Korea increased its short-term holdings by close to $10b (and slightly reduced its long-term holdings). That likely reflects preparation for a new round of funding for its sovereign fund. The Saudi data incidentally also shows a sharp rise in their short-term bank deposits in December - a step that likely augers the imminent creation of a sovereign fund.
The UK added $13.1b despite being a big net seller of Treasuries.
India didn’t really register in the US data in December, despite adding a ton to its reserves.
For all of 2007, there really shouldn’t be much doubt that the BRICs were a huge source of financing for the US:
China’s recorded claims on the US rose by $157.
Brazil’s recorded claims rose by $86.
Russia’s recorded claims rose by $68b.
The Gulf’s recorded claims rose by $41b (less than 2006).
India’s recorded claims rose by less than a billion.
India keeps a lot of its reserves with the BIS, so they don’t appear in the US data. But it also added almost $100b to its reserves in 2007. The available evidence suggests more than a bit of diversification on India’s part.
A graph of the BRICs US holdings is revealing (Graph courtesy of Arpana Pandey of the CFR).
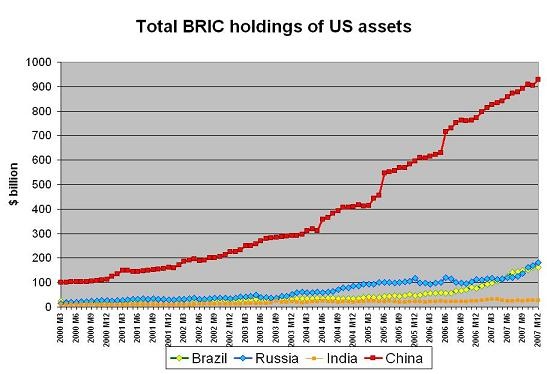
All four of the BRICs added to their reserves in 2007. But the holdings of only 3 of the BRICs rose.
China’s recorded holdings of US debt - counting all its holdings, not just its Treasury holdings -- are now about $950b. And that likely is a substantial undercount. If China kept something like 70% of its rising foreign assets in US dollars, its end-2007 holdings should be close to $1230b (the Orange line the following Pandey/ Setser graph).
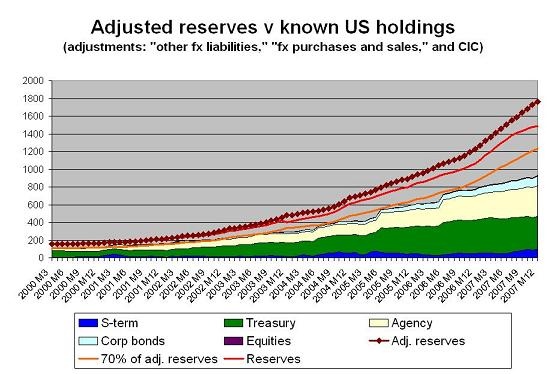
Remember, the last good data point for China comes back in June 2006. And in June 2006, China had about $700b fewer foreign assets than it does now -- according to a very conservative accounting of the growth of China’s foreign assets. The real total could be closer to $800b.
The US data shows only a $200b increase in China’s claims on the US over that time. That either implies that China bought a ton of euros, loonies, pounds and Aussie dollars. Or it implies that the US data is not capturing all of China’s purchases.
My guess is that the US data isn’t capturing all of China’s purchases. We should have a better sense in about six weeks, when the Treasury releases the results of the June 2007 survey.
UPDATE: My take on the TIC data is rather different than the unnamed analysts referenced in Molinski’s Wall Street Journal story, who viewed the TIC data as positive because it showed inflows not outflows and ongoing demand for US equities showed that foreign investors retained confidence in the US. Suffice to say that a country with large deficits has to attract inflows -- if the the q3 drought in capital flows was sustained, the US would be in real trouble. And at least to me, the large share of the net inflows coming from the official sector is evidence of a lack of demand for US assets, a lack of demand that turned into pressure on the dollar and prompted an upturn in official intervention.
More on: